Data-Driven Commuting: How I Sliced My Travel Time in Half with Apple Shortcuts
Introduction
Commuting can be a major time drain, with traffic that feels both chaotic and unpredictable. This project is a deep dive into my own daily commute, automating the collection of real-time travel data between my home and work. By systematically logging traffic patterns every five minutes, I transformed a frustrating daily variable into a predictable system, allowing me to identify the most efficient departure times and reclaim hours of my week.
The Problem: A Commute of Extremes
My daily commute time fluctuated dramatically. On a good day, the trip was a swift 22 minutes. On a bad day, it could stretch to over an hour, leaving me stuck in traffic and starting or ending my day with unnecessary stress. Relying on guesswork was inefficient. I needed a robust, data-backed approach to answer a simple question: When is the absolute best time to leave? Manually tracking this would be tedious, so I developed a fully automated solution using the tools already in my pocket.
The Technical Setup: An Automated Data Analyst
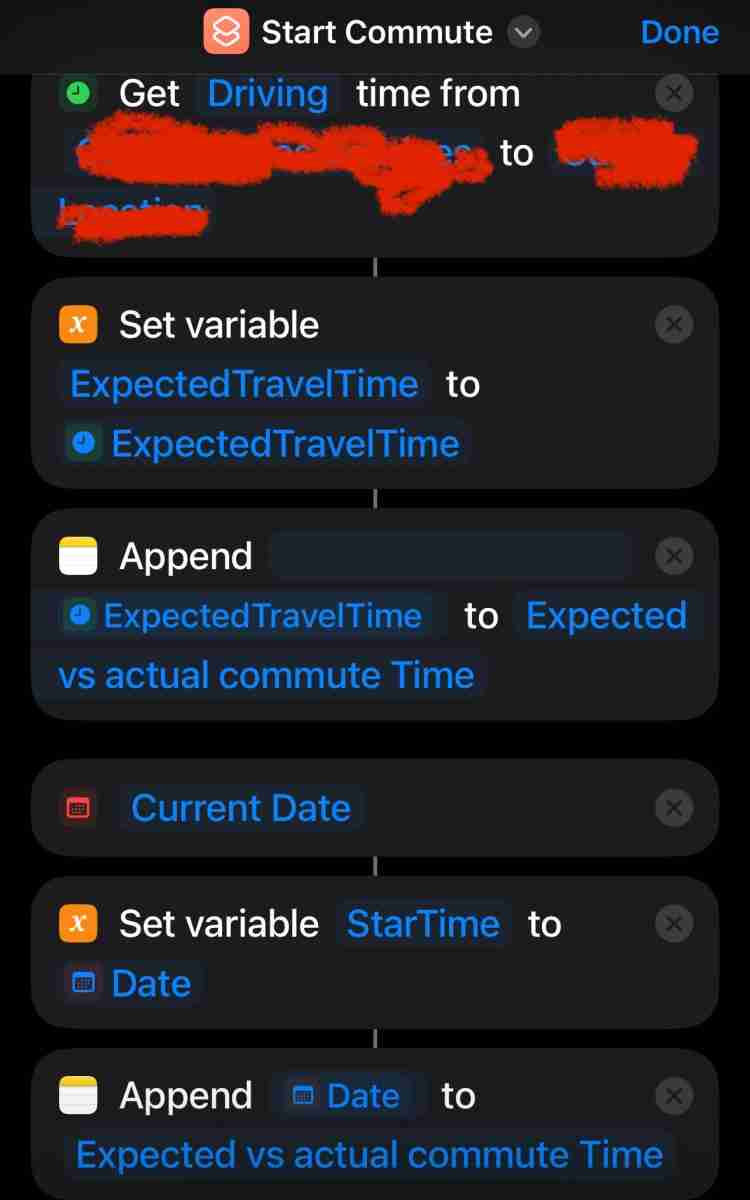
I created a zero-maintenance data collection system using my iPhone and Apple Shortcuts.
- Tools and Technologies:
- Apple Shortcuts: The engine for automating the entire workflow.
- Apple Maps: The source for real-time commute durations based on live traffic.
- iPhone 14 Pro: The device running the automation silently in the background.
- Automation Process:
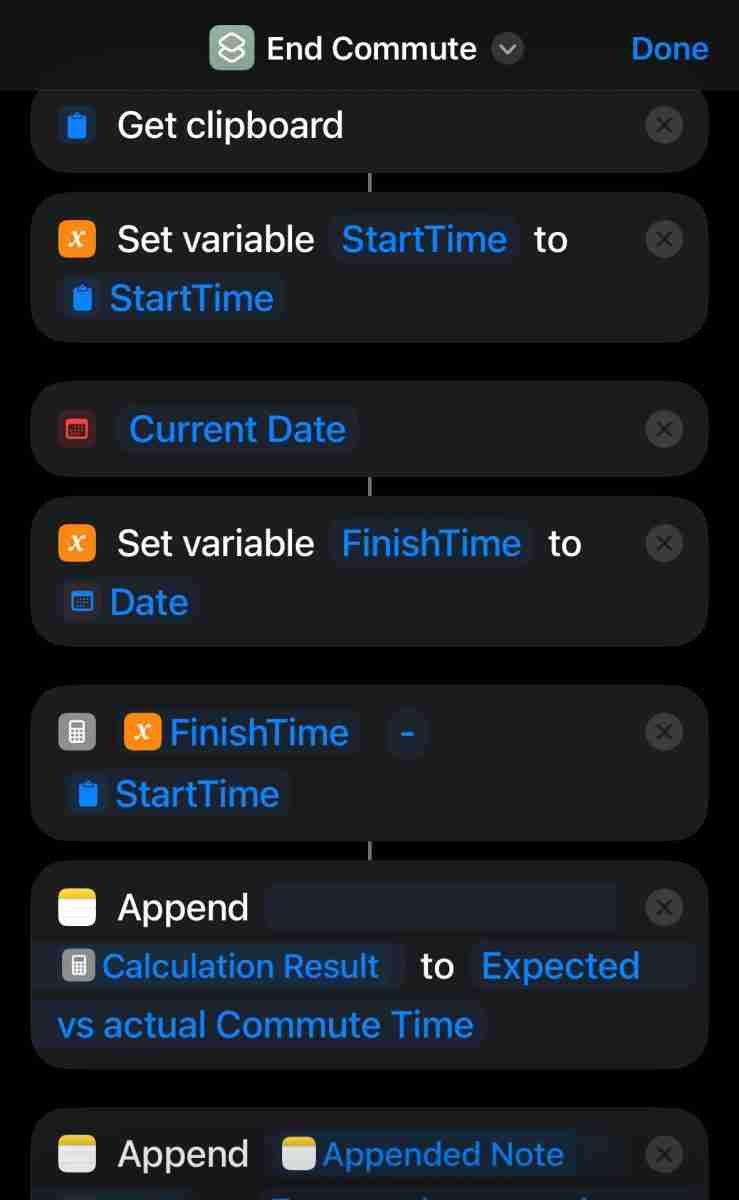
- Morning Window (7:00 AM – 10:30 AM): Each weekday morning, an automation triggers. Every five minutes, it fetches the current commute time from home to work and logs the timestamp and duration to a CSV file.
- Evening Window (4:30 PM – 7:00 PM): The process repeats in the afternoon. The system logs the commute time from the office back home, capturing the evening rush hour dynamics.
- Data Aggregation: Over several months, this system collected thousands of data points (2389 data points) without any manual intervention, building a rich dataset ready for analysis.
Data Analysis & Key Findings
After collecting sufficient data, I analyzed the logs and uncovered clear, actionable patterns that were invisible day-to-day.
The base commute time with no traffic was approximately 22 minutes. However, traffic added anywhere from 10 to 45 minutes to that baseline.
1. The Morning Rush Hour (7:00 AM – 9:30 AM) The data revealed a very defined morning peak.
- Worst Time: Commute times began to climb sharply after 7:15 AM, peaking between 7:45 AM and 8:30 AM. During this window, the commute regularly took 50-60+ minutes—more than double the baseline.
- Best Time: Leaving before 7:15 AM kept the trip under 35 minutes. For a truly optimal commute, waiting until after 9:15 AM was the best strategy, as the time consistently dropped to a much more reasonable 25-30 minutes.
2. The Evening Peak (4:30 PM – 7:00 PM) The evening rush showed a similar, though less extreme, pattern.
- Worst Time: The peak occurred between 5:30 PM and 6:45 PM, with travel times frequently hitting 40-45 minutes.
- Best Time: An early departure right at 4:30 PM or waiting until after 7:30 PM proved to be the most effective times, with the commute often falling below 25 minutes.
3. The “Friday Effect” A fascinating insight was how much Friday differed from the rest of the week. Both morning and evening traffic were significantly lighter, making the commute fast and predictable even during typical “peak” hours.
The Impact: Reclaiming Time and Reducing Emissions
The results of this data-driven approach were immediate and significant, impacting not only my schedule but also my environmental footprint.
Environmental Benefit: The 23 km route is the same, but how I drive it has changed. By shifting to off-peak times, my car operates with far greater fuel efficiency, avoiding extended periods of idling and inefficient stop-and-go acceleration. Based on the difference in fuel consumption between heavy and light traffic, I estimate saving approximately 359 liters of fuel annually. This translates directly to a smaller carbon footprint, averting an estimated 829 kg (over 1,800 lbs) of CO2 emissions.
Time Reclaimed: By avoiding the worst traffic, my daily round-trip commute was reduced from an average of 95 minutes to just 50 minutes. This slashed my travel time by 45 minutes daily, saving over 3.5 hours every week and accumulating to 195 hours of reclaimed time annually.
Conclusion and Reflections
This project demonstrates the power of simple, accessible automation to solve a real-world problem. By systematically collecting and analyzing data, I replaced guesswork with certainty, significantly reducing time spent in traffic and improving my daily routine. It’s a clear example of my ability to identify inefficiencies, build a technical solution, and use data analysis to drive meaningful decisions.
Future Work
The system is already providing value, but there’s room for expansion:
- Data Visualization: I plan to use Python (Matplotlib, Seaborn) to create heatmaps and time-series graphs to visualize traffic patterns more intuitively.
- Day-Specific Trends: With more data, I can analyze trends for each day of the week to further refine my departure strategy.
- Real-Time Alerts: The ultimate goal is to develop a system that sends a notification to my phone when traffic conditions on my route have cleared, recommending the optimal moment to leave.